Summary
About this study
This is the first multi-city study in India that examines the association between short-term exposure to PM2.5 (particulate matter <2.5 microns in size) and daily mortality during the time period 2008-2019. We analyse the impact of these short-term PM2.5 exposures across cities in various geographic regions and climatological zones of the country to generate new insights that are relevant for policy.
What did we do?
We studied this in 10 cities (Ahmedabad, Bengaluru, Chennai, Delhi, Hyderabad, Kolkata, Mumbai, Pune, Shimla and Varanasi) between 2008 to 2019. We used a two-stage approach by first evaluating the effects of PM2.5 on mortality in each city individually, and then combining the results for all 10 cities. We also used a causal modelling approach that enabled us to isolate the effect of locally generated air pollution (such as contributions from local transport and waste burning) on mortality.
What data did we use?
We obtained daily counts of mortality from death registries of the 10 cities covered in this study for periods ranging from 3-7 years per city. Our final analysis included over 3.6 million deaths that occurred in these cities over the 2008-2019 study period. Given the sparse nature of air pollution data across many cities, we leveraged our previously developed machine-learning based exposure model that combined data from regulatory monitors, satellites, meteorology and other sources to generate PM2.5 exposure data with a high level of detail in both space (location) and time (duration).
What did we find?
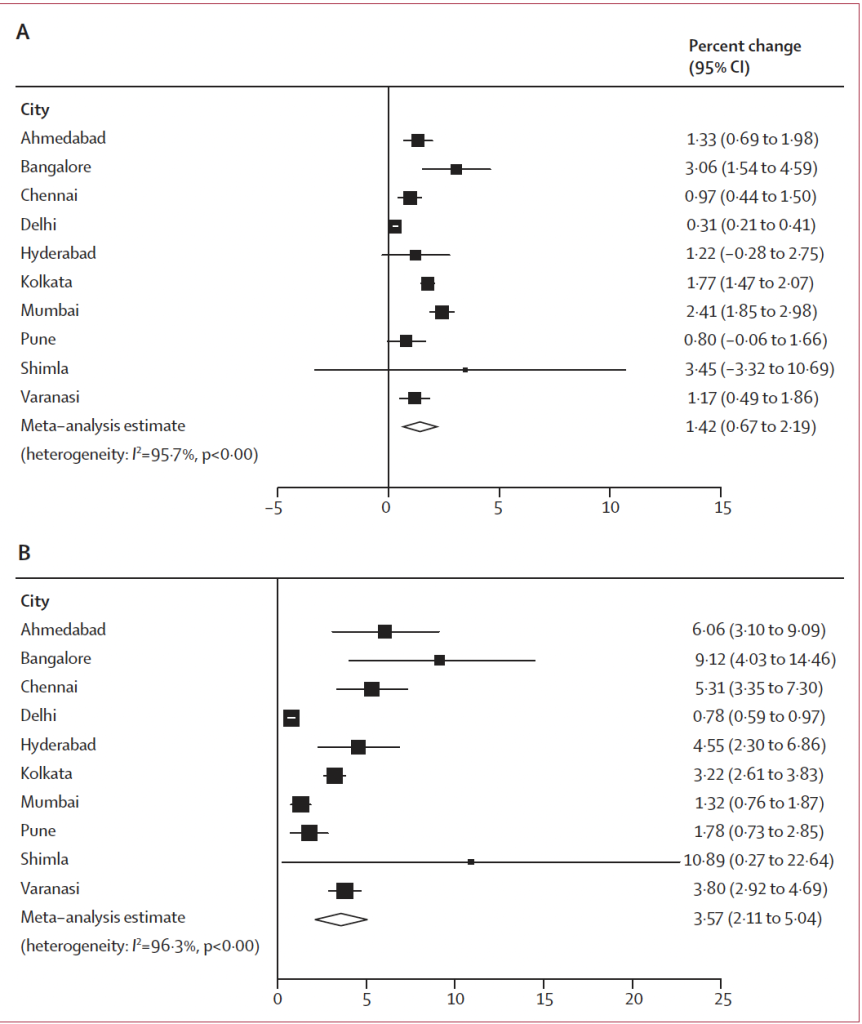
We found that for every 10 μg/m3 increase in the average PM2.5 exposure over a two-day period, the daily mortality across the ten cities increased by 1.42% (Figure 1A). When using our causal modelling approach that isolated the effect of locally generated air pollution, we observed a much stronger effect on daily mortality of 3.57% (Figure 1B).
Our findings also confirmed that the risk of mortality rose more quickly at lower PM2.5 levels but plateaued as levels increased. Significantly, we found mortality risk to be very high (2.65%) even when analysing days with PM2.5 levels below the current Indian NAAQS standard of 60 μg/m3.
City-specific impacts
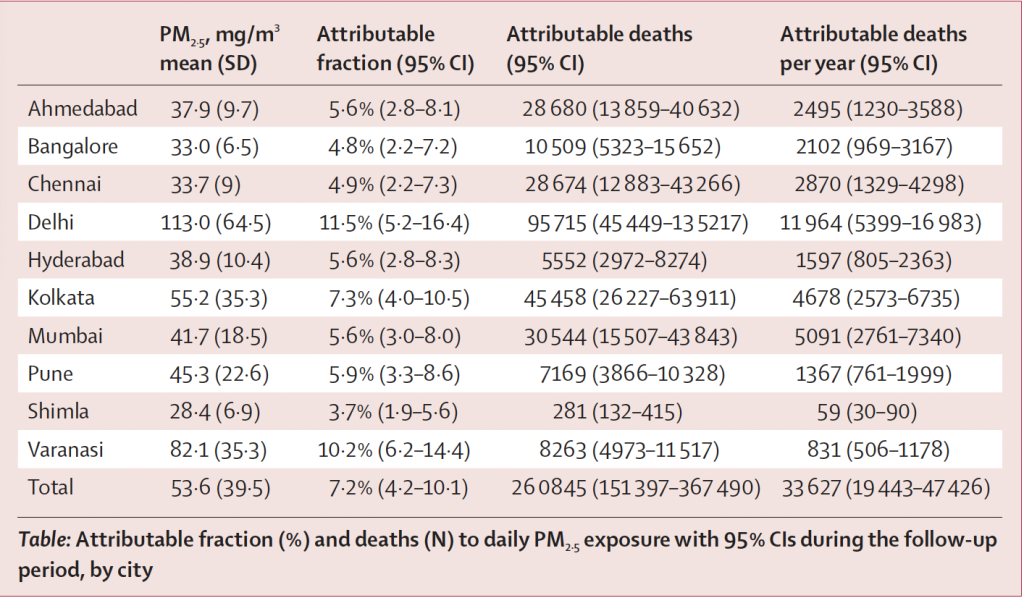
During our study period, we found that 7.2% (95% CI: 4.2-10.1) of all deaths across all 10 cities could be linked to PM2.5 exposure surpassing the WHO guideline value of 15 μg/m3. Delhi had the highest proportion at 11.5% (equating to ~12,000 deaths per year), while Shimla had the lowest at 3.7% (59 deaths per year) between 2008-19.
Over 33,000 deaths each year were attributable to short-term PM2.5 exposures with a significant number of deaths were observed even in cities not considered to have the problem of high air pollution (column 4 in table 1 below).
Why do cleaner cities have higher effect estimates?
In our results, we see that cities such as Bengaluru and Shimla which have relatively lower levels of air pollution showed stronger effects. This is likely due to the sharp increase in risk at lower levels of exposure which plateaus at higher levels which are unlikely to be experienced in these cities (figure 2 below).
What is the causal modelling approach we used and what new insights does it provide?
We used an instrumental variable approach to generate causal effects of locally generated air pollution. To do this, we identified three variables or “instruments” – planetary boundary layer height or mixing height, wind speed and atmospheric pressure – that are directly related to variations in daily air pollution, but are unrelated to daily deaths except through air pollution changes. Through this approach, we isolate the effect of locally generated air pollution since these three instruments are linked to dispersal and transport of air pollution.
The results show us a much higher effect estimate of 3.57% (95% CI: 2.11-5.04), indicating that we might have previously underestimated the effect of short-term air pollution exposures on mortality. The results also highlight the need for (a) greater focus on dispersed local sources of air pollution including transport, waste burning, DG sets, etc., and (b) greater research to unpack deeper insights into the potentially compounding effects of multiple locally generated pollutants (such as PM2.5 and oxides of nitrogen).
What are the implications for national and local air pollution policy?
There are several key takeaways from this study for the development and implementation of health-focused air pollution policy across India:
1. The combination of a steep increase in risk at lower exposure levels, along with significant effects even below the NAAQS standard of 60 μg/m3, show that air pollution is a problem across the country, and even in cities otherwise considered less polluted or to have been meeting air quality standards. Remedial action to mitigate air pollution should therefore expand beyond current “non-attainment” cities.
2. The current NAAQS are substantially higher than they should be as significant effects are seen well below current guideline value for daily exposure to PM2.5 of 60 μg/m3. As the NAAQS are currently under revision, the development of appropriate health-based thresholds can be informed by integrating these results into the standard-setting exercise.
3. Focus cannot only remain on seasonal high exposure events such as during winter, requiring action on all sources year-round. Graded Response Action Plans focused solely on these extremes would only yield marginal benefits with respect to daily mortality, with negative health effects continuing to accrue all year-round even at much lower exposure levels.
4. Our causal analyses highlight the need for greater attention on the numerous dispersed sources of local air pollution across cities including from transport and waste burning among others. These are more challenging to address, but could yield substantial health benefits.
What gaps remain in our understanding?
While our study had several strengths, we also encountered challenges that lead to certain gaps in our understanding of this relationship. First, the lack of accurate information on causes of death across all cities and the lack of data on sex, age and other individual-level variables for some cities made it challenging to generate deeper insights for both policymakers and health professionals. We anticipate the need for the strengthening of health data collection and quality to facilitate the generation of these insights. Second, the lowest PM2.5 concentration observed during the entire study period across any of the cities was 17.1 μg/m3, which therefore served as the counterfactual for our analyses. Evidence from other countries has documented considerable health harms even below these levels, and those data must be considered when identifying appropriate health-based thresholds and interventions.
Read more


